Listed below, are the most frequently reported issues related to SAP system performance:
- Database performance. The DBACOCKPIT transaction, in which we can observe the use of database resources (such as e.g. cache use) constitutes the central point to identify performance issues. By analyzing data, we can improve system performance and reduce resources used. In some cases there is no need to improve performance, such as e.g. for background tasks, which are made at night, and the result is needed by the users in the morning.
- Program execution. Interpreting results from many transactions gathering statistical data or detailed SAP system logs, we can analyze the program duration, determine where the program takes the longest to execute and why, and therefore try to optimize its operation or rewrite the code so that it is more efficient.
- SAP system check. Operational system performance, use of resources – RAM memory, use of CPU processors, I/O statistics, as well as the statistics of calls for tables or SAP system buffers. A SQL inquiry written ineffectively can result in high use of the CPU or in a large number of I/O operations.
What does SAP performance depend on?
If we come across performance issues in our SAP environment, we should first and fore mostly analyze past information about performance for a given period. The data we should pay attention to include answers, processor load, database load, client program implementation/update, costly SQL inquiries, as well as communication with external systems.
If the processor utilization in the system is high and it is not caused by any SAP system application or database, we should verify which process at the operational system level causes SAP slowdown. After the analysis, we should decide whether to optimize/update the operational system or perhaps adding additional resources to the machine is a good solution. Where the load is caused by the database, we should analyze its parameters and after the analysis make the required adjustment.
If the performance issue is caused at the SAP application level, we should analyze an increase of the SAP system memory parameters, taking into account the resources of the operational system and check the background tasks in the SM37 transaction, as well as operating client programs and costly SQL inquiries – whether they cannot be optimized by their authors.
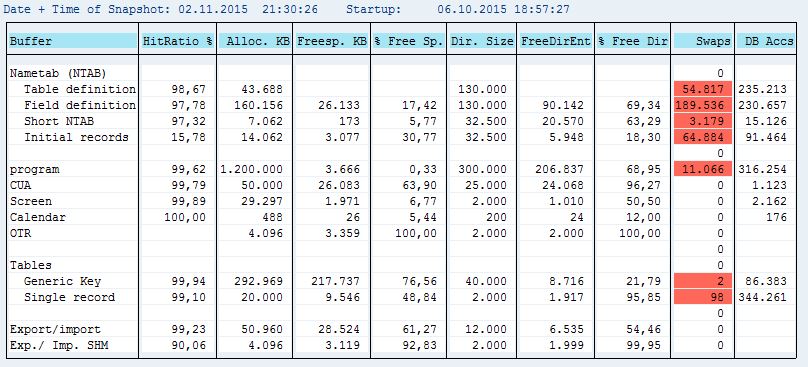
At the SAP system level the system buffer performance can be verified in the ST02 transaction.

Verification of the SAP system buffer performance in the ST02 transaction
Here we can preview the memory parameters in detail and adjust them to the possibilities of the operational system. When at the application level there are no performance issues, then we can go to the lower level – to the database. Numerous bottlenecks can appear here and they need to be removed. The analysis can be commenced from verification of database buffers whether the current values are sufficient. If they are not, we should check how they could be improved so that the change can bring improvement and not an adverse effect. Before implementing the change, the environment has to be analyzed in detail – from the operational system, through the database, and the SAP system. Before we start to change parameters on our own, we should pay attention to the recommendations of SAP included in the SAP notes on service.sap.com.
From the level of the SAP system, we verify programs/transactions for which the database response time is the longest. This time is significantly longer than the time for the CPU processor. At this stage, it is hard to conclude whether the issue results from a non-optimally written program or SQL inquiry. Activating traces on SQL inquiries, we can easily verify/eliminate the issue that could be caused by an inquiry.

Verification of database response time at the SAP system level
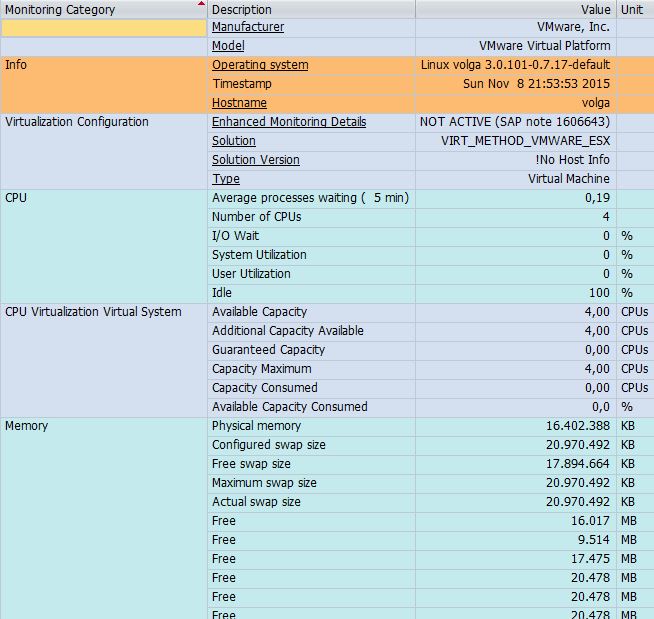
SAP system check – checking the operational system performance
Issues with SQL inquiries result in increased utilization of the processor on the database server, while issues with the ABAP code result in increased utilization of the processor on the application server. Locating the database server and the basic application server on the same host may cause significant degradation in performance. SAP provides transactions through which the administrator can preview the statistics for the operational system – current, as well as past statistics for the processor utilization.
From the level of the SAP system, the statistics are available as hourly averages and they do not precisely indicate what happened during a 5-10 minutes period. Therefore, the operational system should be monitored using tools at the OS level, which thanks to their configurability allow statistics to be gathered in given time intervals, e.g. 5-10 minutes. Having access to detailed statistics, we can precisely determine the moments of particular load of the processor and eliminate the cause of the situation quicker.

Verification of the operational system in the ST06 transaction
The ST06 transaction can be used by the Basis administrators to obtain information on the use of processors and I/O operations. However, if it is necessary to monitor OS in a longer perspective, the administrators should use the operational system tools.
If the processor utilization on the database server is high, first of all it is necessary to pay attention to a non-optimal SQL inquiry. If there is a database server that hosts the SAP application server, it should be ascertained whether some background tasks could be moved to hours outside the highest user activity. The final solution constitutes adding a larger number of CPU’s to the database server if there is such a possibility.
If the use of the processor on the application server is high, first of all we should identify the ABAP programs that should be optimized. We should appropriately modify logging groups in order to evenly distribute the load of user activities between SAP application servers. As in the case of non-optimal SQL inquiries on the database server, it may be necessary to add more CPU’s.
The number of the I/O operations can be monitored from the level of the SAP systems, as well as using other tools, such as AWR reports from the level of the Oracle database. An advantage of the AWR reports is a possibility to configure them in order to automatically gather performance statistics and be able to periodically compare them with historical data. From the level of the SAP system, we can preview the time of readings and records, the number of readings and records, similarly to the level of the Oracle database (DBACOCKPIT -> Wait Event Analysis -> Filesystem Requests).

Verification of the time of reading in the DBACOCKPIT transaction. A good time of reading, time of reading from files does not exceed 5 ms
Issues with potential access to system files can be observed in the v$system_event view from the level of the SAP system. In the presented example, reading of data from the file takes 99.98 ms, which is very long indicating issues with the I/O operations. Good performance of the I/O operation should be less than 10 ms.

The v$system_event view in the SAP system. A long time of reading data from the file indicates issues with I/O operations
Viewing data from DBACOCKPIT -> Wait Event Analysis -> Filesystem Requests, we can identify whether the issue with I/O operations concerns all database files or only some.
Tools and experience
Both SAP and the manufacturer of the operational system provide the SAP administrator with numerous tools, which allow viewing the correctness of the system operation. Their skillful use helps to effectively remove performance issues of the SAP environment. Detailed and careful analysis allows solving numerous problems bothering the SAP environment; however, an attempt to take a shortcut may have an adverse effect.
Performance issues have a complex nature and at first sight, they may cause dizziness. BCC (now All for One Poland) technical consultants have knowledge and experience gained during many technical projects for clients, as well as during works related to the SAP administration service (both for the systems maintained at the client, as well as hosted in All for One Data Centers). Their knowledge and skills are used for analysis and improvement of the SAP system performance.

