A large number of companies still confine themselves to the analysis of historical data, its visualization and calculation, based on their performance indicators in the current and previous periods. In fact, the data collected allows for prediction, i.e. forecasting the future. It is precisely the knowledge about the probability of occurrence of certain phenomena that can provide real support for the decision-making process concerning further development of the company, both at the operational and strategic level. According to research, companies that use predictive analytics in their sales campaigns are almost twice as effective as companies that use only traditional marketing methods.
Where to use it?
It is not only the marketing department where predictive analytics can be applied. Predictive algorithms will be useful in monitoring the production process, planning deliveries, assessing the financial risk or forecasting sales revenues. They can be used both in retail businesses, in health centers (e.g. to forecast the spread of diseases), in the public sector (e.g. for crime analysis), in banking (for risk management and customer segmentation), in insurance (e.g. for claims analysis) and finally in manufacturing companies (e.g. to optimize the production process).
To enable the performance of these analyses, SAP Predictive Analytics provides a number of built-in functions facilitating model building and automation of the entire prediction process. Thanks to built-in functions for data preparation, visualization and available algorithms, the construction of regression models, decision trees, time series analysis, customer segmentation, market basket analysis or the use of neural networks are not time-consuming. It does not require the user to know advanced statistical and econometric methods.
At the same time, SAP Predictive Analytics also allows you to write your own programs if you need to build complex models. It enables you to use R scripts and SAP HANA APL (Automated Predictive Library). As the only tool of this class, it provides native integration with SAP software, in particular with SAP HANA, SAP S/4HANA, SAP BusinessObjects and SAP BW.
User groups
In large business entities, there are usually three groups of users of predictive analytics. The vast majority (over 95%) are business users, whose knowledge on the use of advanced statistical, econometric or data mining methods is relatively small.
Only a small group of employees know how to use them or are experts in quantitative methods.
In order to meet the expectations of all user groups, SAP Predictive Analytics enables working in two modules: an automatic module and an expert module. In the first case, the process of preparing data, building a model or using it is carried out “step by step” and requires the user to do only a minimal configuration and parametrization.
In the expert module, simple modeling is also possible, but at the same time you can use advanced methods of data preparation or R scripts from the Internet or your own ones. Details of working with both modules are presented in the practical part of the article.
In the application, you can use data from:
- file sources (*.xls, *.xlsx, *.csv, *.txt, *.log, *.prn, *.tsv),
- the clipboard,
- the world of BO objects,
- the SAP BW data warehouse,
- relational databases (via SQL queries),
- SAP HANA.
It is worth noting that there are two options of using SAP HANA data, i.e. downloading data or connecting directly to the database.
On the basis of the results obtained, you can create visualizations and reports that can be published and made available to other users through:
- Files: CSV, EXCEL, PDF,
- BI Platform,
- SAP HANA,
- SAP Analytics Cloud,
- SAP Lumira Server.
The automated modelling process does not mean that it is not possible to assess the predictive properties of the model. On the contrary, in the automatic module of SAP Predictive Analytics, two measures are calculated for each model: predictive power (Ki) and prediction confidence (Kr). The former one (Ki) is a software specific measure and measures the ability of explaining values of target variables by explanatory variables. It takes values from 0 to 1, and the higher the value, the better the model matches the data. The prediction confidence Kr measures the ability of a model to be as effective for a new data set as it is for test data. It is assumed that the model can be used for forecasting or implications in another data set if the value of this indicator is greater than 0.95. In the case of the expert module, standard static tests are calculated to assess the significance of individual parameters (e.g. a student’s t-test) as well as the whole model (e.g. R2 coefficient).
In addition, SAP Predictive Analytics allows you to automate the model management process. For this purpose, a desktop version of the data manager is provided. It enables the creation of dynamic data sets and thus increases the efficiency of using models for other time intervals or other objects.
The client-server version of the software includes the Predictive Factory, which enables the import of models, time series segmentation, automatic deviation testing, forecasting, model performance monitoring and scheduling.
There are four ways to install SAP Predictive Analytics:
- Desktop version
It can be installed on a 64-bit system. It includes both modules, i.e. Expert analytics and automatic analytics.
- Client/Server (without the HANA database)
You can install the desktop version of SAP PA on the same machine as the client/server version if you want to use the expert module. In this version, it is also possible to use the Predictive Factory, which enables scheduling and automation of the model management process.
- SAP PA for HANA
An unquestionable advantage of this installation is the calculation of automatic models and R scripts on the SAP HANA side. Additionally, you can use APL (Automated Predictive Library), a library dedicated to ensure computing efficiency for large data sets.
- SAP PA for SAP HANA in the cloud
It enables the installation of the tool based on SAP HANA HEC (HANA Enterprise Cloud) or HCP (HANA Cloud Platform).
The following description of two cases of model building using SAP Predictive Analytics, version 3.1 presents the ease of use of both modules in practice and their capabilities.
Case 1 – customer segmentation
The fictitious company X decided to improve the effectiveness of its marketing activities and tailor promotional offers to the preferences and capabilities of individual customer groups. It introduced loyalty cards for its regular customers a few years ago. When filling out a card application form, customers provide information about their age, education, profession, marital status, gender, etc. Additionally, the loyalty card shows the expenses incurred by them during the period of use. Both types of data can be used by the company to create clusters for individual customer groups. For this purpose, it will use the automatic module of SAP Predictive Analytics and text files with the relevant data. Below, there are steps to be taken.
1. Selection of a model type
In this case, a cluster model was selected out of the available algorithms. Once selected, the wizard guides the user step-by-step through the configuration of the model.
2. Indication of a data source
The company X decided to use the data from the CSV file. In the program, is it possible to preview data, provide missing values, translate specific categories or set a filter limiting the data set for further analysis.
3. Selection of variables
By default, all variables (except the customer number) in the dataset have the status of explanatory variables in the case of this model. Some variables from this set can be dragged & dropped to the target variables section or excluded from further analysis. In the case of a cluster model, it is not necessary to indicate an outcome variable, but without it the program will not be able to calculate the model performance measures: Kr and Ki. Since the goal of the company X is to make customers buy as much as possible, the expenses incurred by them were set as an outcome variable. It is necessary to make sure that there are not too many explanatory variables not only in this model type, but also in others, since this makes it difficult to interpret the results obtained.
4. Indication of the number of clusters to be singled out on the basis of the model
It is not necessary to enter a single value, but a range. Then the program will estimate the models for each value in the given range separately and will indicate the best of them. The number of indicated clusters for the model depends on business reasons and the possibility of constructing a specific number of dedicated marketing offers.
5. Selection of a proper model
After the calculations have been completed, the system indicates for each model the values of Ki and Kr measures and the percentage of customers who have not been assigned to any of the clusters created. Based on the sum of confidence measures and predictive power, the best model is automatically selected – for seven clusters in the analyzed case.
Choosing the right model (for seven clusters)
6. Analysis of model results
The obtained results can be easily analyzed by displaying profiles of individual clusters or aggregated statistics. The profiles provide us, for example, with the information that in the analyzed case most of the customers were qualified to cluster 6 (23.58%), and their age is between 47 and 90 years.
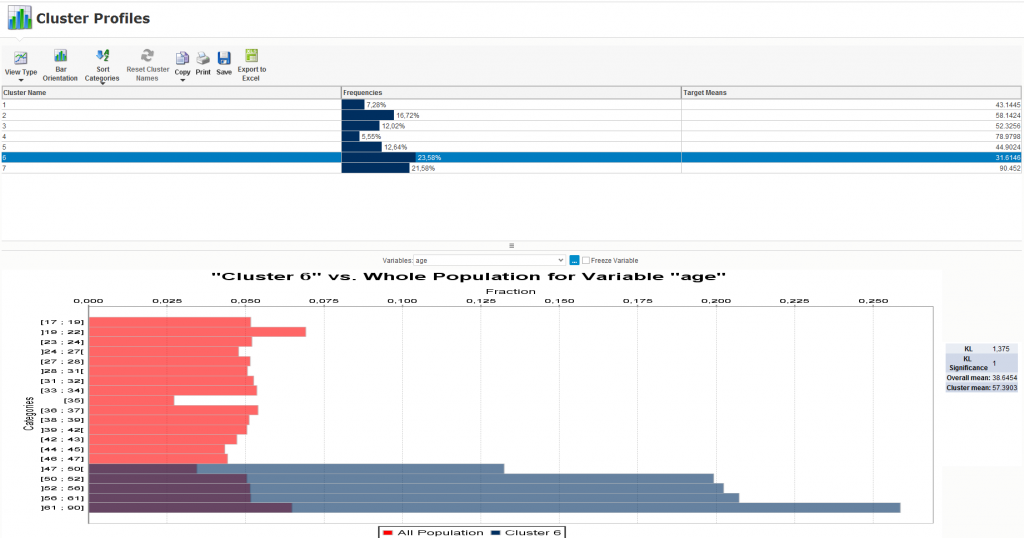
Analysis of the results of the model
And the section of statistical reports indicates, among others, which variables were most important when individual clusters were singled out. In our case, it turned out that age is the most significant variable when defining the cluster 1, 2, 4, 5 or 6, and marital status for the cluster 3. It is also possible to display a chart showing the size of individual clusters and their location on the axis of coordinate systems relative to two variables, e.g. age and expenses.

Analysis of model results in the case of cluster 3
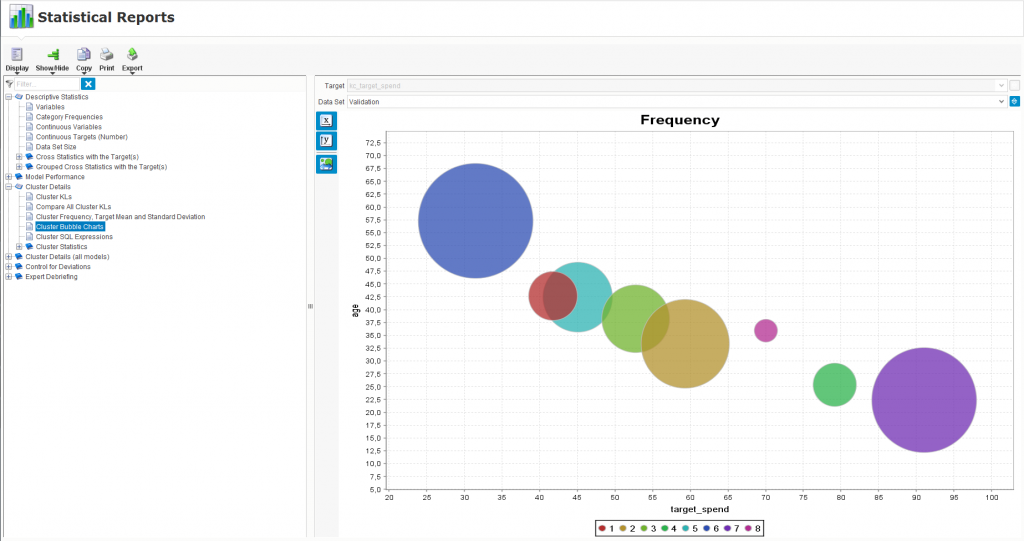
Chart showing the size of individual clusters and their location on the axis of the coordinate system
7. Applying the model to a new data set
After saving the model, it is possible to use it repeatedly for new customers who have filled in the loyalty card application but have not made any purchases with it yet. After selecting a file with a new set of data as a result of the model’s operation, we obtain an assignment of customers to individual clusters. The only thing left to do is to use this information in practice.
Case 2 – forecast of sales revenues
The fictitious company Y was to estimate its sales revenues for the next 12 months. It decided to make this forecast based on the analysis of time series and a smoothing model for a trend and seasonality. It would also be possible to use a regression model for this purpose and thus make the revenue dependent on other variables. The company decided to use the expert module of SAP Predictive Analytics, for which it will obtain data directly from the SAP BW data warehouse. Below are the steps to be taken in order to obtain the results.
1. Selection of a data source
Out of the possible data sources, the company Y decided to select data directly from the SAP BW warehouse. After logging in, SAP Predictive Analytics gains access to the queries defined in the BEX Query Designer tool on this system.
2. Indications of measures and dimensions for analysis
Out of all the indicators and characteristics defined in the selected query, those to be used for further analysis have to be indicated. Since the company Y is interested in analyzing sales on a monthly basis, the only indicated measure is Sales, and the dimension is: Cal. Year/month.
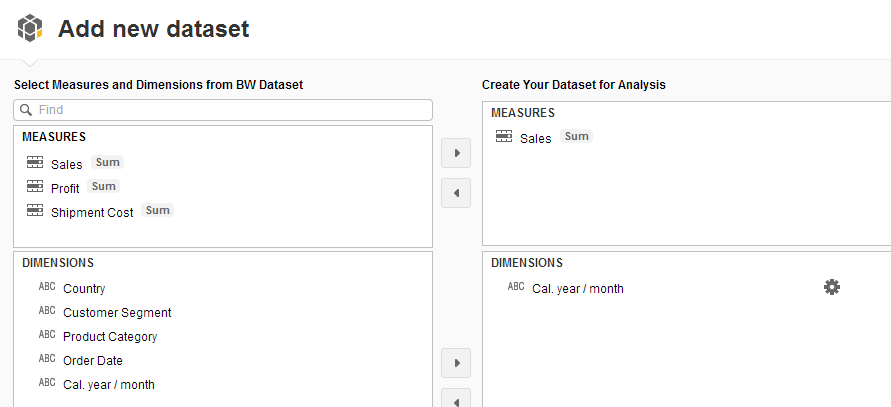
Indication of measurements and results for analysis
3. Data preparation
The data preparation section allows the user to filter data, transform, change values, create formulas for both measures and dimensions, combine dimensions, group values, etc. In the simplified case under analysis, no additional processing of the model input data is necessary.
4. Selection of algorithms
In the next step, the calculations to be performed on the data set under analysis must be configured.
They can include functions related to data preparation (e.g. normalization, filtering, sample drawing, statistics calculation), data saving (e.g. to a CSV file) or appropriate algorithms for model estimation (e.g. neural networks, decision trees, classifications, regression models, time series analysis, identification of extreme values). The order of calculations must be indicated using the drag & drop function and diagram. Here, also one’s own R scripts can be used.
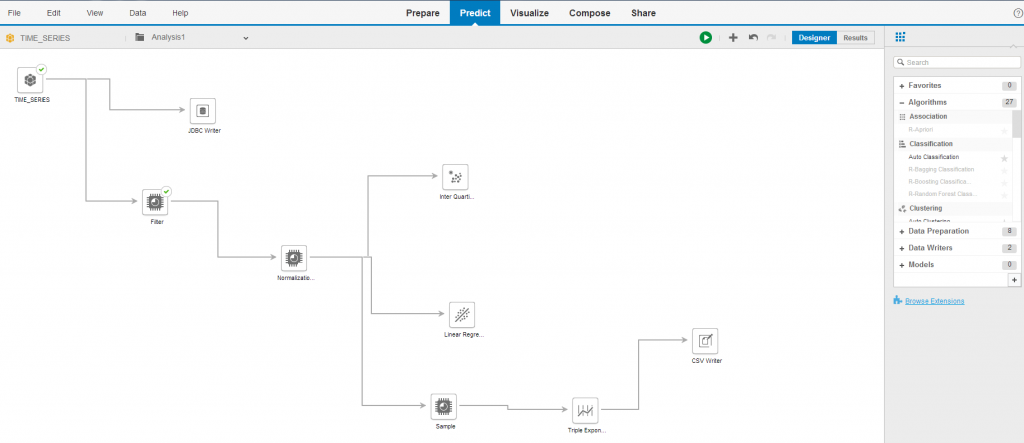
Choosing an algorithm. Indication of the calculation order
5. Configuration of calculations
The company Y finally decided to use only the Triple exponential smoothing algorithm for time series analysis in the previous step. In its configuration, it was sufficient to indicate the type of result (forecast), the number of forecast periods (12), the explained variable (Sales), the value of the period (month) and the name of the column for the values obtained on the basis of the model. After the configuration is complete, calculations can be performed.
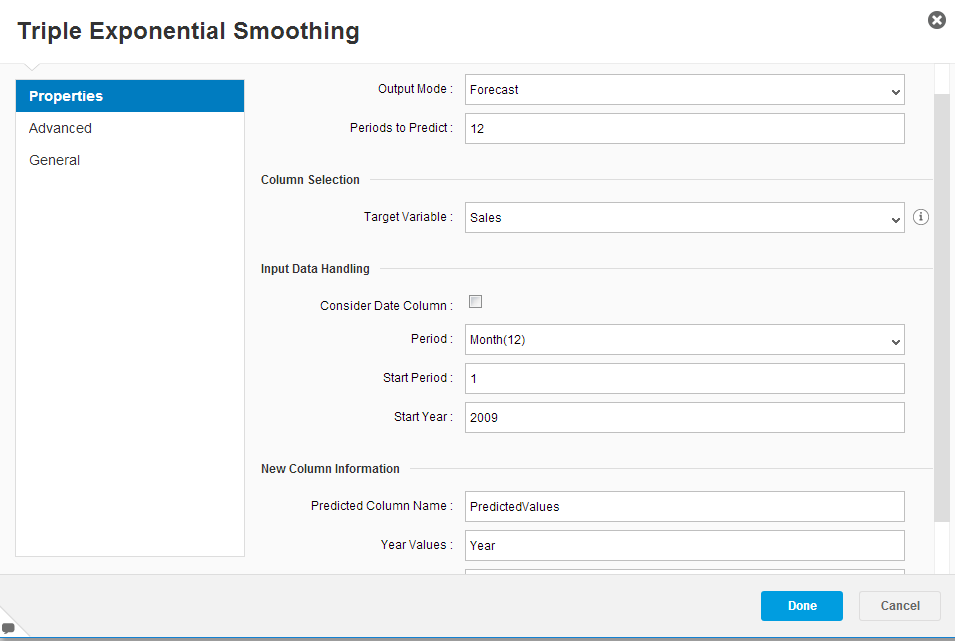
Configuration of calculations
6. Analysis of results
The analysis of results allows you to review the actual values and those obtained on the basis of the model, to view the statistics describing the properties of the model and its predictive capabilities and to display a chart comparing both values.
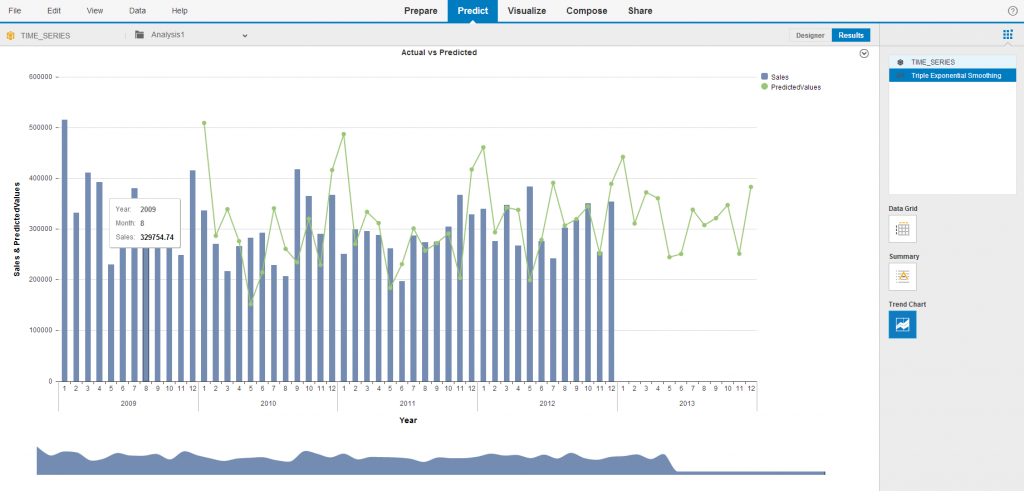
Analysis of results
7. Visualization of the results obtained
Based on available data, the tool allows you to create advanced data charts, including column, line, pie, mixed, waterfall charts, geographic and heat maps, and to present data in the form of tables.
8. Construction of a report
After configuring the tables and charts that are to present the results, it is possible to define infographics or dashboards. For this purpose, text fields, drawings or data selection fields can be additionally used.
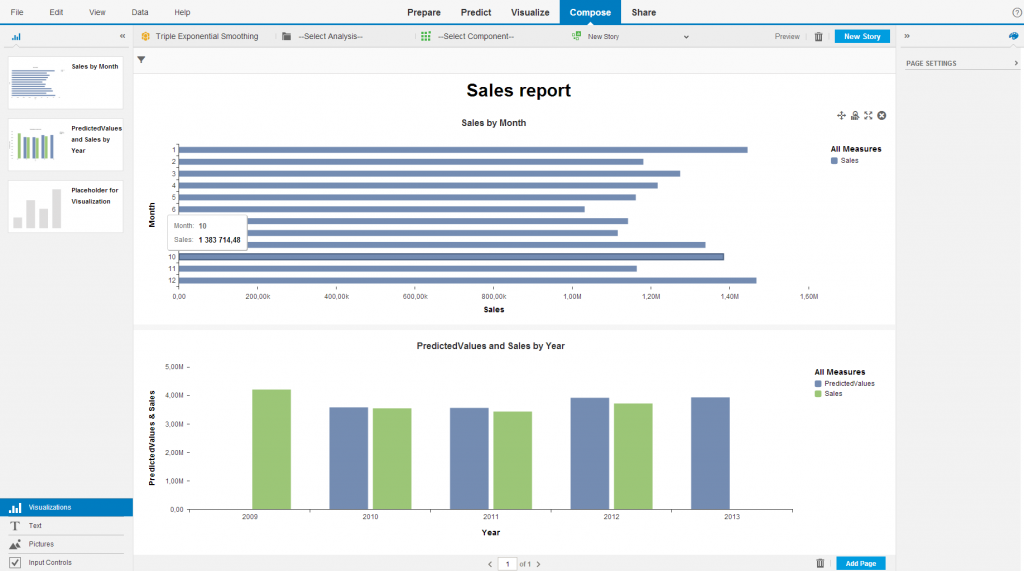
9. Publication
The results of the analysis can be saved to a file, published on the BI or SAP HANA platform. The obtained forecast may help make decisions regarding the purchase of raw materials, human resources planning or further marketing activities.
The possibilities of using predictive analytics in an organization to make decisions at each level of management are practically unlimited. There are just a few examples presented above. Their application is slowly becoming indispensable in order to remain competitive in the future and to meet the expectations of customers or business partners. For this purpose, it is recommended to use a tool that will allow automation and thus reduce the time consumption of the entire modeling process. At the same time, it will enable the use of more complex algorithms or the analysis of large data sets. It would also be desirable for it to be compatible with SAP systems and programs already existing in the organization. All these requirements are met by SAP Predictive Analytics.

