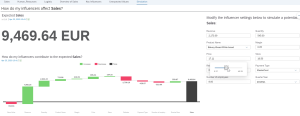
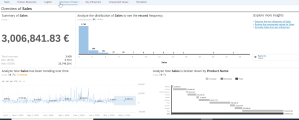
Embedded analytics refers to a set of additional functions for real-time operational analysis that are available in S/4HANA. This component consists of both CDS (core data service) views that are data sources, and Fiori Analytical applications used for data visualization. This article is focused on the CDS views and their integration with BI tools such as: Analysis for Microsoft Office or SAP Analytics Cloud.
Core data service
Technically, the core data service is an extension of the standard SQL query semantics with the Data Definition Language (DDL). This enables relatively easy and transparent definition of semantically rich tables and their views. The views created can include the following functions:
- conversion, e.g. of currency, units of measure or number systems;
- text functions, e.g. merging, replacing, cutting;
- arithmetic functions, such as rounding, absolute value, division;
- date and time functions, e.g. period validation, calculation;
- aggregates, e.g. minimum, maximum, average, sum.
It is possible to create all kinds of relationships and assign authorizations. As a result, the views created in CDS can combine a number of tables and already existing views, and the data contained in them can be restricted, grouped and transformed according to later reporting requirements. Thus, in practice, the entire data model and necessary calculations are made in the database server, not in the application. This can be crucial for performance when reporting on complex views. The CDS views are created as ABAP objects in Eclipse, however their structure and data can be displayed in standard SAP transactions such as SE11 or SE16. It should be added that SAP provides many ready-to-use views and reports.
In order for a given view to be used for reporting, it must be assigned the appropriate data category in BI tools. Most often it will be a cube. The list of possible categories and the data they can contain is presented in the table.
| Data category | Master data | Transactional data | Metrics | Can be linked to master data |
| Dimension | + | – | – | + |
| Fact | – | + | + | – |
| Cube | – | + | + | + |
| Aggregation Level | – | – | + | + |
The assignment of data categories enables the automatic generation of the information provider, the so-called transient provider, when activating the CDS view. The generated object can be used in Business Intelligence reporting tools. Thus, based on the transient provider, you can build reports, e.g. in BEX Query Designer, and then display or visualize them in Fiori, Lumira, SAC, Analysis for Microsoft Office and other tools. Reports defined in BEX Query Designer may contain additional parameters, structure definitions, filters, formulas or limitations of specific cells. They will present real-time data as it is in the transactional system.
Analyzing current data in Excel
For business users, especially in the area of controlling or accounting, Microsoft Excel remains indispensable for performing in-depth analyses. Many reports from both the transactional system and the data warehouse are saved locally on the user’s computer and then only analyzed from Excel. There are at least two inconveniences associated with this:
- locally saved reports do not contain the most recent data;
- the only way to add an additional metric or dimension that has been omitted is to regenerate the report in the system and save it to the file.
It is much easier and efficient to analyze data directly from the system.
SAP Business Intelligence enables connection with S/4HANA data from both Excel, Word and Power Point. In the former case, the Analysis for Microsoft Excel program installed on the user’s computer looks like a standard spreadsheet when opened. Additional ribbons are the only difference and the key one is Analysis. It enables you to connect to the S/4HANA system and open a report configured for the transient provider. When displayed, the report is presented in the form of a pivot table that allows you to add additional dimensions/metrics to the dropdown and to filter the data. You can open several reports from S/4HANA and BW in one workbook or even in a single spreadsheet.
As the application itself is only an add-on to the Microsoft tool, other Excel features are still available. Thus, it is possible to create charts, insert additional calculations, conditional formatting or other objects. All this is based on current data, directly from the system.
From the MS Office package, it is also possible to connect to the S/4HANA system via Analysis for Word and Analysis for PowerPoint. The presentation created in Power Point can therefore show data in real time, and the entire procedure looks the same as in the case of Excel.
SAP Analytics Cloud
Much more possibilities of analyzing data directly from S/4HANA are provided by SAP Analytics Cloud. Importantly, it does not require additional software to be installed on the end user’s computer. To use the SAC functionality, all you need is a web browser (preferably Chrome) running on your computer or mobile device. In order to be able to use the report defined in S/4HANA as a transient provider, you must establish an appropriate connection between SAC and the live source system. The established connection allows you to create data models that reflect the reports defined on the S/4HANA side.
SAP Analytics Cloud is a combination of BI reporting, predictive analytics, and planning in one cloud environment. As an analytical layer, SAP Business Technology Platform supports advanced analyses throughout the enterprise.
The scope of application of current data coming directly from the S4/HANA system in SAC is wide and enables, among other things:
- creating interactive reports (stories) that may contain data from various customer systems, files, databases, as well as external sources, such as websites. The defined reports can include charts, maps, tables, drop-down lists, filters, texts, images and other components;
- designing web applications;
- forecasting specific figures, such as cost level, value and quantity of sales in subsequent periods on the basis of trend and regression models, as well as classification of customers depending on their characteristics;
- using current data as a starting point for planning the costs and revenues of the enterprise in the subsequent period;
- comparing current actual values with previously planned or forecasted ones;
- data analysis with “search to insight", i.e. using intelligent search;
- simulations.


S/4HANA data analysis in SAP Analytics Cloud – examples
Authorizations
When creating reports, you should not forget about authorizations. The use of CDS views requires additional configuration or creation of CDS access control objects for this purpose, however the assignment of authorizations can be integrated with the existing policy in this area. In particular, new authorization objects specifically created for this purpose in the SU21 transaction, or existing ones already in use in other functional areas of the system can be used to assign authorizations.
Using authorization objects, you can limit a report to a specific dataset for a given user. It is also possible to grant authorizations to reports as a whole, depending on the name of the report, the information provider on which it was built, or the area it covers.
Always up-to-date reports
When starting work with SAP S/4HANA, it is definitely recommended to consider using embedded analytics and CDS views not only in the context of data analysis directly in Fiori, but also in BI tools. The analysis of current data using Microsoft Excel will undoubtedly contribute to greater efficiency of analysts’ work, and will also speed up the process of making decisions, especially operational ones. Basing plans and forecasts on current data in the SAP Analytics Cloud environment will result in more accurate decisions regarding the future operation of the enterprise, and will also enable presentation and visualization of obtained results to the management board or external stakeholders.
However, it should be remembered that the solution should primarily support the process of making operational decisions. For historical analyses using data from external systems or for complex value transformation and strategic decision making, the data warehouse should still be the first choice.
