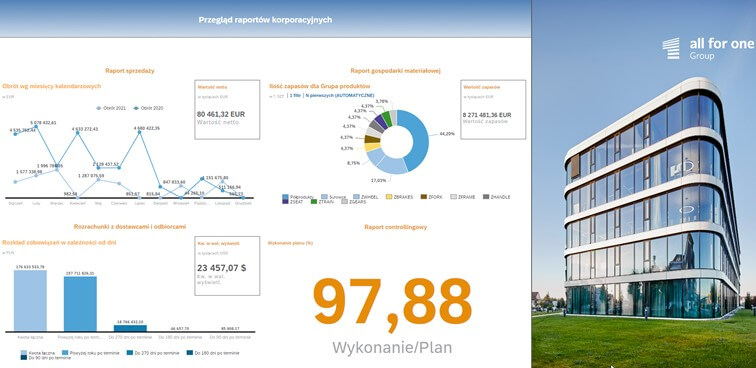
The SAC Starter Pack is a set of four predefined analytics applications for analyzing:
- sales data,
- accounts receivable/payable,
- inventory levels and purchases,
- controlling costs.
The source data used in the reporting process in this case are data from the customer’s system: SAP BW, S/4HANA or SAP ECC 6.0 with ABAP 7.5. In addition to the presentation of data in tabular form and charts, various types of buttons, switches, drop-down lists and checkboxes have been used in individual applications to enable navigation through the report and facilitate data drilling.
The proposed applications consist of two or three tabs, each of which presents a different aspect of an issue. On all screens, it is possible to save tabular data to an MS Excel or CSV file, while charts can be saved in PDF format. Reports are customizable both functionally (changing the reported dimensions) and visually. We present a full description of the reports, the scope of the offer and the assumptions made.
Reports
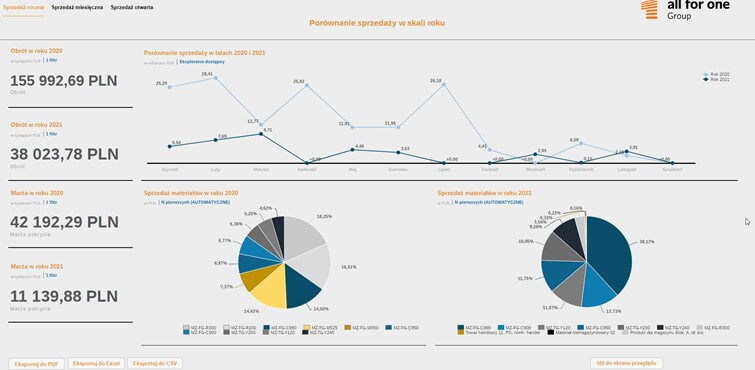
The first of the proposed reports deals with sales data analyzed in three different areas:
- year-on-year comparison of sales values,
- detailed analysis of a given period,
- analysis of open sales.
The annual sales tab allows for sales values to be analyzed by month in two consecutive years. They are assumed to be the current and previous year. In addition, pie charts included in this section show the structure of sales by products sold in both compared periods.
Another tab – monthly sales – allows you to analyze data for a given period in different dimensions: by region, customer, material group, material or distribution channel. The data are additionally presented in tabular form. The last part of the report – open sales – contains a table of sales values and quantities for orders and open deliveries.
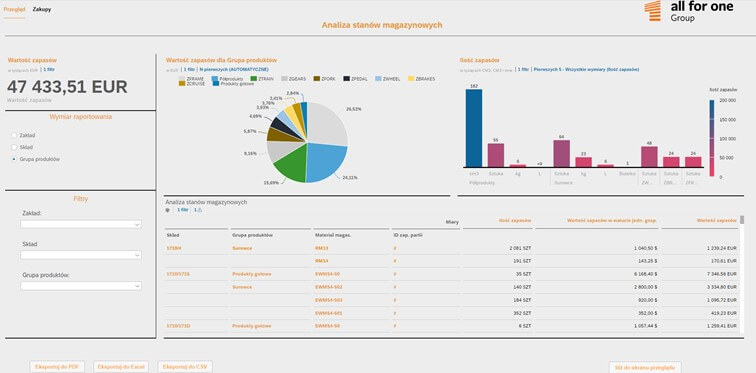
The current value and quantity of inventory, taking into account specific material indices, product groups, batches, a storage location or a plant, can be analyzed in the materials management report. The second part of this report, purchases, allows you to view the value of purchase orders and incoming invoices from the last few months. In addition, it contains a chart presenting the average and weighted average price of individual product groups and material indices for the analyzed period.
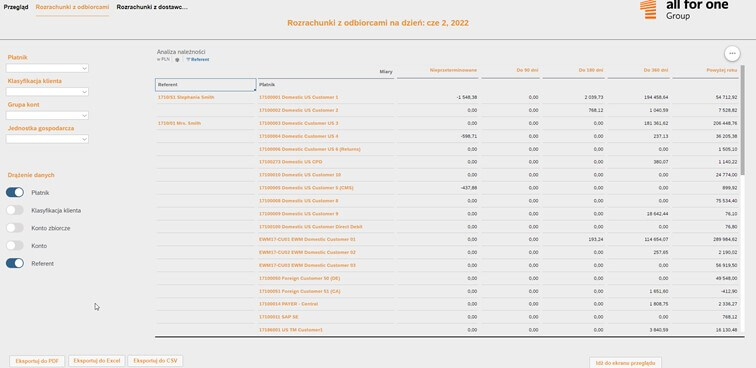
The accounts receivable/payable report allows you to analyze unpaid incoming and outgoing invoices, taking into account established aging ranges. Both receivables and payables are presented in graphical (first tab) and tabular form. In addition to comparing the value of overdue payments for each aging range, the charts allow you to determine the payers and suppliers with the largest value of outstanding payments. The other two tabs of the report are a detailed analysis of accounts data in a tabular form with the option of displaying the counterparty, sales department, account, reconciliation account and accounting clerk.
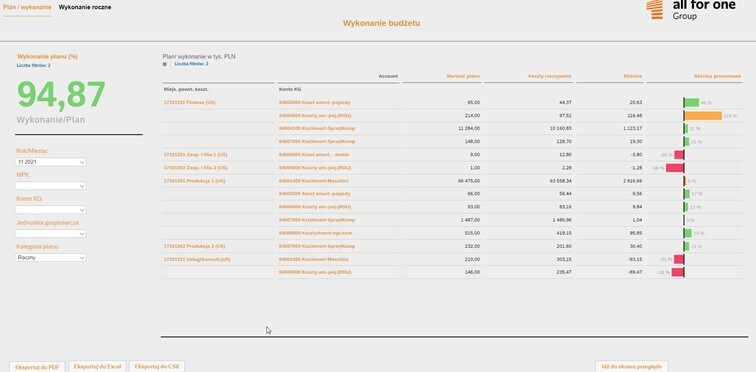
The last report – controlling costs – allows you to compare planned and actual values (the first tab) and to review these costs in individual periods of a given year (the second tab). Both parts of the report present data taking into account the period, cost center and cost account. For planning data, it is also possible to select the appropriate type of plan. The planning data available in the report are loaded into SAC using an MS Excel flat file. The comparison of planned values with execution is additionally visualized with thumbnail charts for each item.
For this report, the use of the planning functionality provided by SAP Analytics Cloud is not assumed. Planning in SAC is very versatile. It provides many options related to the flexibility of implementing the plan, its automation or the approval process, however it requires additional licenses. Therefore, the report package we provide at the start does not include this functionality.
All reports can be accessed from an additionally configured analytical application: Overview of corporate reports.
SAC Starter Pack reports
- Sales Report
- Materials Management Report
- Accounts Receivable/Payable Report
- Controlling Cost Report
- Overview of Corporate Reports
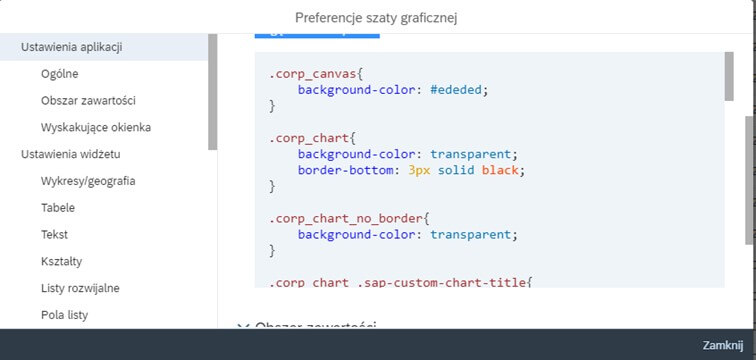
- PCSS (Cascading Style Sheets) file to manage the graphic design of reports
Customization of reports
The analytical applications proposed in the SAC Starter Pack are, as far as possible, universal and address data areas that are actually analyzed in virtually every enterprise. However, we realize that they are not always viewed in the cross sections or dimensions we suggest. Hence, at the implementation stage, it is possible to customize the reports functionally, that is, taking into account the dimensions and indicators used in a particular enterprise, as long as they are available in the data source. The type of charts and tables is also customizable at the implementation stage.
It is also obvious that the reports need visual customization, including the insertion of appropriate graphic elements, for example a company logo or illustration in an overview report. To facilitate the management of the graphic design of analytical applications, together with the reports we provide a CSS template that makes it easier to set the appropriate colors, font or border elements for the entire group of analyses.
Data sources
Currently, source systems for the SAC Starter Pack can be: S/4HANA, SAP BW or SAP ECC 6.0 (ABAP 7.5). In particular, the following data sources are assumed to be used:
- S/4HANA: standard CDS views from individual thematic areas provided by SAP as part of embedded analytics;
- SAP BW (version 7.4 or higher) or SAP BW/4HANA: data flows from individual areas already existing in the customer’s system and queries defined on them.
In the absence of appropriate information providers, it is assumed that the relevant data flow from BI content will be activated and modified if necessary; this will be priced additionally; - SAP ECC 6.0 (with ABAP 7.5): as in the case of the S/4HANA system, the use of appropriate CDS views is assumed. However, in this case, such views are not available on the standard basis and will probably have to be defined, which may be subject to additional pricing.
In addition, as already mentioned, when describing reports, an MS Excel file is used to load planned data.
What does the offer include?
The SAC Starter Pack offer of All for One Poland includes:
- analytical applications for reporting data from four thematic areas described earlier;
- CSS to adjust the appearance of the report to corporate standards;
- customization of reports to meet customer needs;
- launching SAP Analytics Cloud and establishing the appropriate connection.
Our offer does not include activities related to the provision of relevant data on the side of the source system. Such tasks are priced additionally.
The SAC Starter Pack offering allows for quick implementations of reports in basic thematic areas. The ability to customize them both functionally and visually to meet the needs of the company is undoubtedly an additional argument in favor of using it. The proposed layout of reports and their functionality is a reliable template and an excellent starting point to facilitate the implementation of the first SAC reports in a short period of time. It is a good start to enjoy the adventure with SAP Analytics Cloud.


